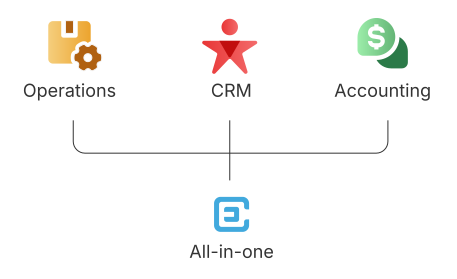
Freight Business Intelligence

Freight Data Analytics Software for Freight Forwarders

Freight Data Analytics Software for Freight Forwarders

CargoEZ freight data analytics software connects shipment, cost, finance, sales and customer data in one platform. Visualize the KPIs that matter, filter detailed records and turn freight activity into decisions that protect margin.

CargoEZ freight data analytics software connects shipment, cost, finance, sales and customer data in one platform. Visualize the KPIs that matter, filter detailed records and turn freight activity into decisions that protect margin.

Connected module data

Customizable reports

Cloud access

rate management

04

04

04

Connected data areas

05

05

05

Core financial report views

01

01

01

Unified analytics workspace

Real-Time

Real-Time

Real-Time

Operational visibility

Turn Connected Freight Data Into Clear Business Insight

Bring operational, sales, customer and finance information together, then explore it through dashboards, filters and reports built for everyday freight decisions.
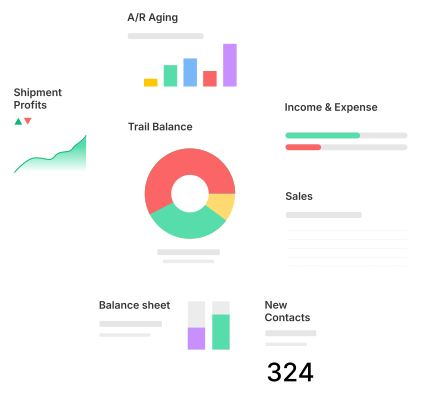
dashboard
dashboard
Financial Analytics

Review expenses, income, net profit and gross profit alongside Profit and Loss, Balance Sheet and Trial Balance reports.
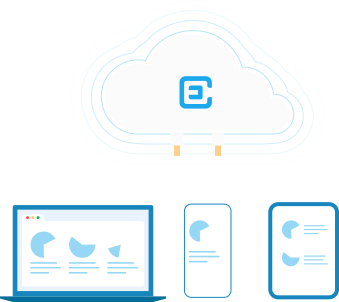
cloud service
cloud service
Cloud-Based Access

Give authorized teams access to connected analytics and reports wherever they work through a cloud-based platform.
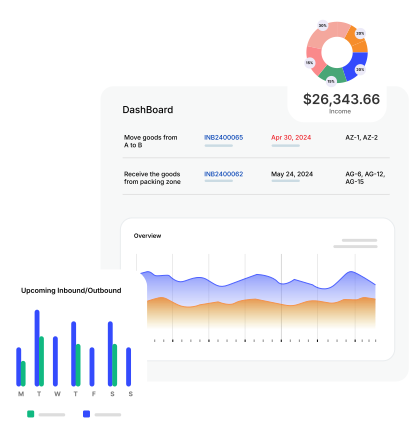
Freight Operations Dashboard

Review shipment, booking, checklist and documentation information with operational metrics in one view.
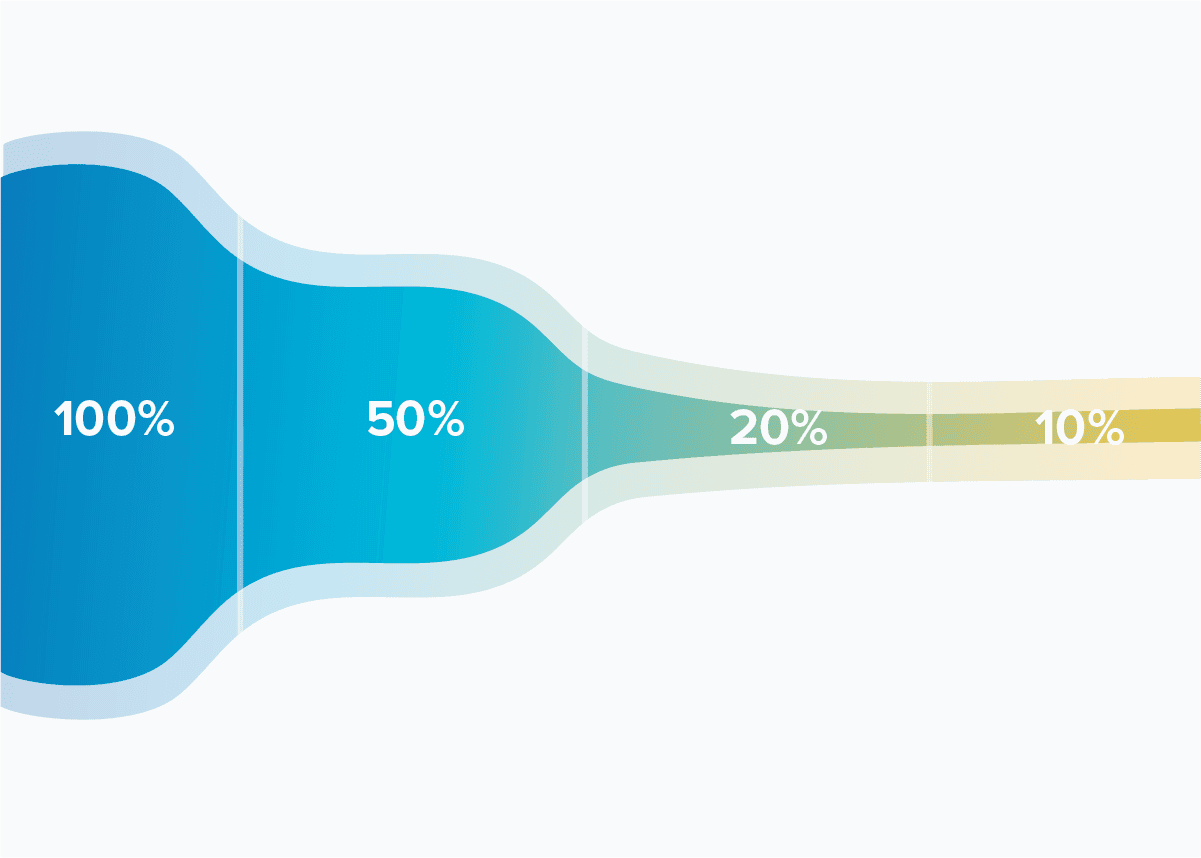
Sales Pipeline Analytics

Track lead activity and sales pipeline KPIs to understand progress, focus follow-ups and support commercial decisions.

Contact Analytics

View customer and contact information, including monthly contact creation summaries, in a structured reporting view.

Tracking

Bookings

Checklists

Shipments

Documentation

Unified Freight Data

Connect purchase orders, shipment costs, invoices and other records available across CargoEZ in one analytics workspace.

  • Profit and Loss

    Balance Sheet

    Trial Balance

    Line item Summary

    Reconciliation Report

  • Profit and Loss

    Balance Sheet

    Trial Balance

    Line item Summary

    Reconciliation Report

Flexible Reporting

Generate operational, sales and finance reports that help each team review performance with the context it needs.

Filter

Filter

Customizable Filters

Filter relevant records by the fields and periods your team needs, then move from a high-level KPI to detailed data.

See How CargoEZ Works

See How CargoEZ Works

See how connected data becomes a practical view of freight operations, financial performance, sales activity and customer records.

See how connected data becomes a practical view of freight operations, financial performance, sales activity and customer records.

Start with the dashboard for your role

Filter information to the detail you need

Review trends and generate a useful report

Smarter workflows. Sharper insights.
Simpler freight.

  • That’s CargoEZ Air Freight Software built for the forwarder who’s ready to move faster.

From Freight Activity to Business Action

From Freight Activity to Business Action

Follow one connected workflow from source data to a practical operational or financial decision.

Follow one connected workflow from source data to a practical operational or financial decision.

  1. Connect Module Data

    Bring rates, CRM, shipments and finance records into the analytics flow.

  2. Standardize Information

    Organize available records into a consistent view for analysis.

  3. Select a Dashboard

    Open the operations, sales, finance or contact view relevant to your role.

  4. Apply Filters

    Focus the data by period, customer, shipment or other available fields.

  5. Compare KPIs

    Review cost, revenue, profit, shipment and sales metrics in context.

  6. Identify Trends or Exceptions

    Find patterns, unusual results or areas that need closer attention.

  7. Generate a Report

    Turn the filtered view into a clear operational, sales or finance report.

  8. Take Action

    Use the insight to guide the next operational or financial decision.

Rates + CRM + Shipments + Finance Unified Freight Data KPI Dashboard Filter and Drill Down Compare Performance Identify Trends or Exceptions Generate Report Take Action

Use Freight Data to Answer the Questions That Matter

Replace fragmented reviews with connected insight into freight spend, shipment activity and business trends.

01
Control Freight Spend

Analyze shipment costs, expenses, income and profitability to find costly patterns and make better-informed decisions.

Review cost and income together

Compare gross and net profit

Investigate margin changes

02
Track Shipment Performance

Use connected operations data to monitor shipments, bookings, checklists, documentation and available performance metrics.

View operational activity

Filter shipment records

Support faster follow-up

03
Plan With Historical Trends

Compare operational, sales and financial history across periods to identify patterns that support budgeting and planning.

View operational activity

Filter shipment records

Support faster follow-up

Forecasting scope: CargoEZ supports trend-based planning with the operational, sales and finance data available in the platform. External market forecasting should be confirmed with CargoEZ for your specific requirements.

Forecasting scope: CargoEZ supports trend-based planning with the operational, sales and finance data available in the platform. External market forecasting should be confirmed with CargoEZ for your specific requirements.

Forecasting scope: CargoEZ supports trend-based planning with the operational, sales and finance data available in the platform. External market forecasting should be confirmed with CargoEZ for your specific requirements.

Make Freight Decisions With Better Context

CargoEZ helps teams move from scattered operational records to connected insight across freight activity, costs, sales and customers.

Better Freight Spend Visibility

Review shipment costs, expenses & income together to understand where money is being used.

Clearer Profitability Insights

Compare gross profit, net profit and financial reports with connected freight activity.

Faster Reporting

Use dashboards, filters and structured reports instead of rebuilding every view from separate files.

Improved Shipment Visibility

Bring shipment and operations information into one accessible view for ongoing review.

Stronger Sales and Customer Decisions

Use sales pipeline and contact data to guide follow-ups and account conversations.

Less Manual Data Consolidation

Reduce the work of collecting information from disconnected spreadsheets before analysis can begin.

Dashboards for Operations, Sales, Finance and Management

Give each team a focused starting point while keeping the underlying freight information connected across the business.

freight operations
Operations
leads
Sales
finance
Finance
Management
freight operations
Operations
leads
Sales
finance
Finance
Management
freight data
freight data
Freight Operations Analytics

Review connected shipment and operational activity in a practical dashboard.

Shipment and booking information

Checklist and documentation activity

Filterable operational records
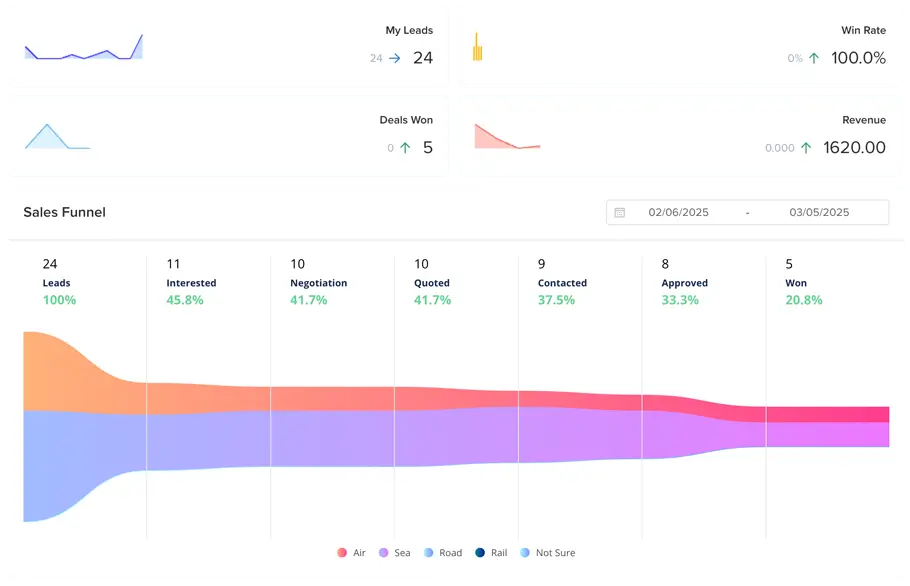
leads dashboard
Sales Pipeline Analytics

Follow lead activity and pipeline KPIs so the commercial team can focus on the right next actions.

Shipment and booking information

Checklist and documentation activity

Filterable operational records
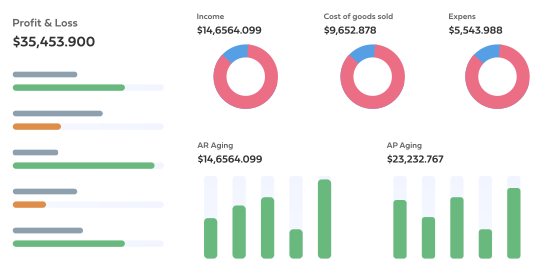
finace dashboard
Freight Financial Analytics

Connect income, expenses and profit views with the reports finance teams use.

Gross and net profit

Profit and Loss, Balance Sheet and Trial Balance

Line item and reconciliation reports

  • profile avatar

    Mr.Bessie Cooper

    Individual

    RM:

    Jerome Bell

    New

  • profile avatar

    Prime Consultants Ltd

    NVOCC

    RM:

    Kathryn Murphy

  • profile avatar

    Black, Marvin

    Warehouse

    RM:

    Devon Lane

  • profile avatar

    Hajdú Szilveszter...

    Company

    RM:

    Cameron Williamson

  • profile avatar

    Edwards

    Trucker

    RM:

    Dianne Russell

  • profile avatar

    Henry, Arthur

    Warehouse

    RM:

    Annette Black

  • profile avatar

    Flores, Juanita

    Company

    RM:

    Bessie Cooper

  • profile avatar

    Miles, Esther

    Individual

    RM:

    Robert Fox

  • profile avatar

    Mr.Bessie Cooper

    Individual

    RM:

    Jerome Bell

    New

  • profile avatar

    Prime Consultants Ltd

    NVOCC

    RM:

    Kathryn Murphy

  • profile avatar

    Black, Marvin

    Warehouse

    RM:

    Devon Lane

  • profile avatar

    Hajdú Szilveszter...

    Company

    RM:

    Cameron Williamson

  • profile avatar

    Edwards

    Trucker

    RM:

    Dianne Russell

  • profile avatar

    Henry, Arthur

    Warehouse

    RM:

    Annette Black

  • profile avatar

    Flores, Juanita

    Company

    RM:

    Bessie Cooper

  • profile avatar

    Miles, Esther

    Individual

    RM:

    Robert Fox

Management Overview

Bring operational, sales, customer and finance indicators together for a wider business view.

Cross-functional KPI review

Period and performance comparisons

Reports for planning discussions

freight operations

Freight Operations

leads

Leads

finance

Finance

Contacts

CargoEZ vs Disconnected Spreadsheets

CargoEZ vs Disconnected Spreadsheets

CargoEZ vs Disconnected Spreadsheets

See what changes when freight reporting starts with connected operational and financial information.

See what changes when freight reporting starts with connected operational and financial information.

See what changes when freight reporting starts with connected operational and financial information.

Reporting need

Reporting need

Disconnected spreadsheets

Disconnected spreadsheets

CargoEZ analytics

Data preparation

Data preparation

Manual file consolidation

Connected module data

Operational visibility

Operational visibility

Separate records and updates

One dashboard view

Financial context

Financial context

Reviewed in another file

Income, costs and profit connected

Analysis

Analysis

Rebuild formulas and tables

Apply filters and review KPIs

Reporting

Reporting

Static versions across teams

Flexible role-based reports

See Your Freight Data in a Clearer Way

Tell us what your team needs to measure. We will show you how CargoEZ connects operations, sales and finance data for practical reporting.

Review the dashboards relevant to your role

Explore filters and reporting workflows

Confirm data, planning and integration requirements

Book a Free Demo

Share a few details and the CargoEZ team can continue the conversation.

Local page preview. Submission is not connected to a live CRM.

Analytics Becomes Stronger When the Workflow Is Connected

Use data created across CargoEZ modules as context for operational,
commercial and financial reporting.

RATES

RATES

Rate Management

Organize freight pricing and support connected quote workflows.

Explore module

SALES

SALES

Freight CRM

Connect leads, customers, follow-ups and commercial activity.

Explore module

OPERATIONS

OPERATIONS

Freight Operations

Keep shipment, booking, tracking and documentation data together.

Explore module

FINANCE

FINANCE

Accounts and Finance

Connect financial reports, income, expenses and profitability context.

Explore module

Frequently Asked Questions

Frequently Asked Questions

What is freight data analytics software?

Freight data analytics software collects, processes and visualizes shipping metrics, carrier performance and cost data to help logistics teams improve visibility, control expenses and make better operational decisions.

What data can CargoEZ analyze?

CargoEZ brings together purchase orders, shipment costs, invoices, freight operations, sales pipeline, finance and contact data available in the platform.

How can CargoEZ help control freight spend?

CargoEZ gives teams visibility into shipment costs, expenses, income, gross profit and net profit so they can identify patterns and review areas affecting margin.

Can CargoEZ track shipment performance?

CargoEZ connects shipment and operational data, including bookings, tracking activity, checklists and documentation, with dashboards and performance metrics.

Can I create customized freight reports?

Yes. Customizable filters help teams retrieve relevant data and generate reports aligned with operational, sales and finance needs.

Which financial reports are available?

CargoEZ provides Profit and Loss, Balance Sheet, Trial Balance, line item summaries and reconciliation reports.

Can CargoEZ support forecasting and planning?

CargoEZ helps teams compare historical operational, sales and finance data to identify trends and support planning. External market forecasts should be discussed with CargoEZ based on your requirements.

How does CargoEZ connect data across modules?

CargoEZ connects data from Rate Management, Freight CRM, freight operations and Accounts and Finance into one analytics view, reducing separate spreadsheet consolidation.

What is freight data analytics software?

Freight data analytics software collects, processes and visualizes shipping metrics, carrier performance and cost data to help logistics teams improve visibility, control expenses and make better operational decisions.

What data can CargoEZ analyze?

CargoEZ brings together purchase orders, shipment costs, invoices, freight operations, sales pipeline, finance and contact data available in the platform.

How can CargoEZ help control freight spend?

CargoEZ gives teams visibility into shipment costs, expenses, income, gross profit and net profit so they can identify patterns and review areas affecting margin.

Can CargoEZ track shipment performance?

CargoEZ connects shipment and operational data, including bookings, tracking activity, checklists and documentation, with dashboards and performance metrics.

Can I create customized freight reports?

Yes. Customizable filters help teams retrieve relevant data and generate reports aligned with operational, sales and finance needs.

Which financial reports are available?

CargoEZ provides Profit and Loss, Balance Sheet, Trial Balance, line item summaries and reconciliation reports.

Can CargoEZ support forecasting and planning?

CargoEZ helps teams compare historical operational, sales and finance data to identify trends and support planning. External market forecasts should be discussed with CargoEZ based on your requirements.

How does CargoEZ connect data across modules?

CargoEZ connects data from Rate Management, Freight CRM, freight operations and Accounts and Finance into one analytics view, reducing separate spreadsheet consolidation.

Ready to Turn Freight Data Into Action?

Book a free demo and explore CargoEZ analytics with your reporting needs in mind.

  • Senator International Shipping Co. WLL logo
  • Air7Seas Transport Logistics, Inc. logo
  • Nacs Logo
  • Defense Program Support logo
  • T.I.M.E. Cargo logo
  • STRABE Logistics logo
  • Senator International Shipping Co. WLL logo
  • Air7Seas Transport Logistics, Inc. logo
  • Nacs Logo
  • Defense Program Support logo
  • T.I.M.E. Cargo logo
  • STRABE Logistics logo
  • Senator International Shipping Co. WLL logo
  • Air7Seas Transport Logistics, Inc. logo
  • Nacs Logo
  • Defense Program Support logo
  • T.I.M.E. Cargo logo
  • STRABE Logistics logo